


Custom Metrics Made Easy: A Comprehensive Guide to SST and CloudWatch Integration
Improve Your CloudWatch Monitoring with SST and EMF


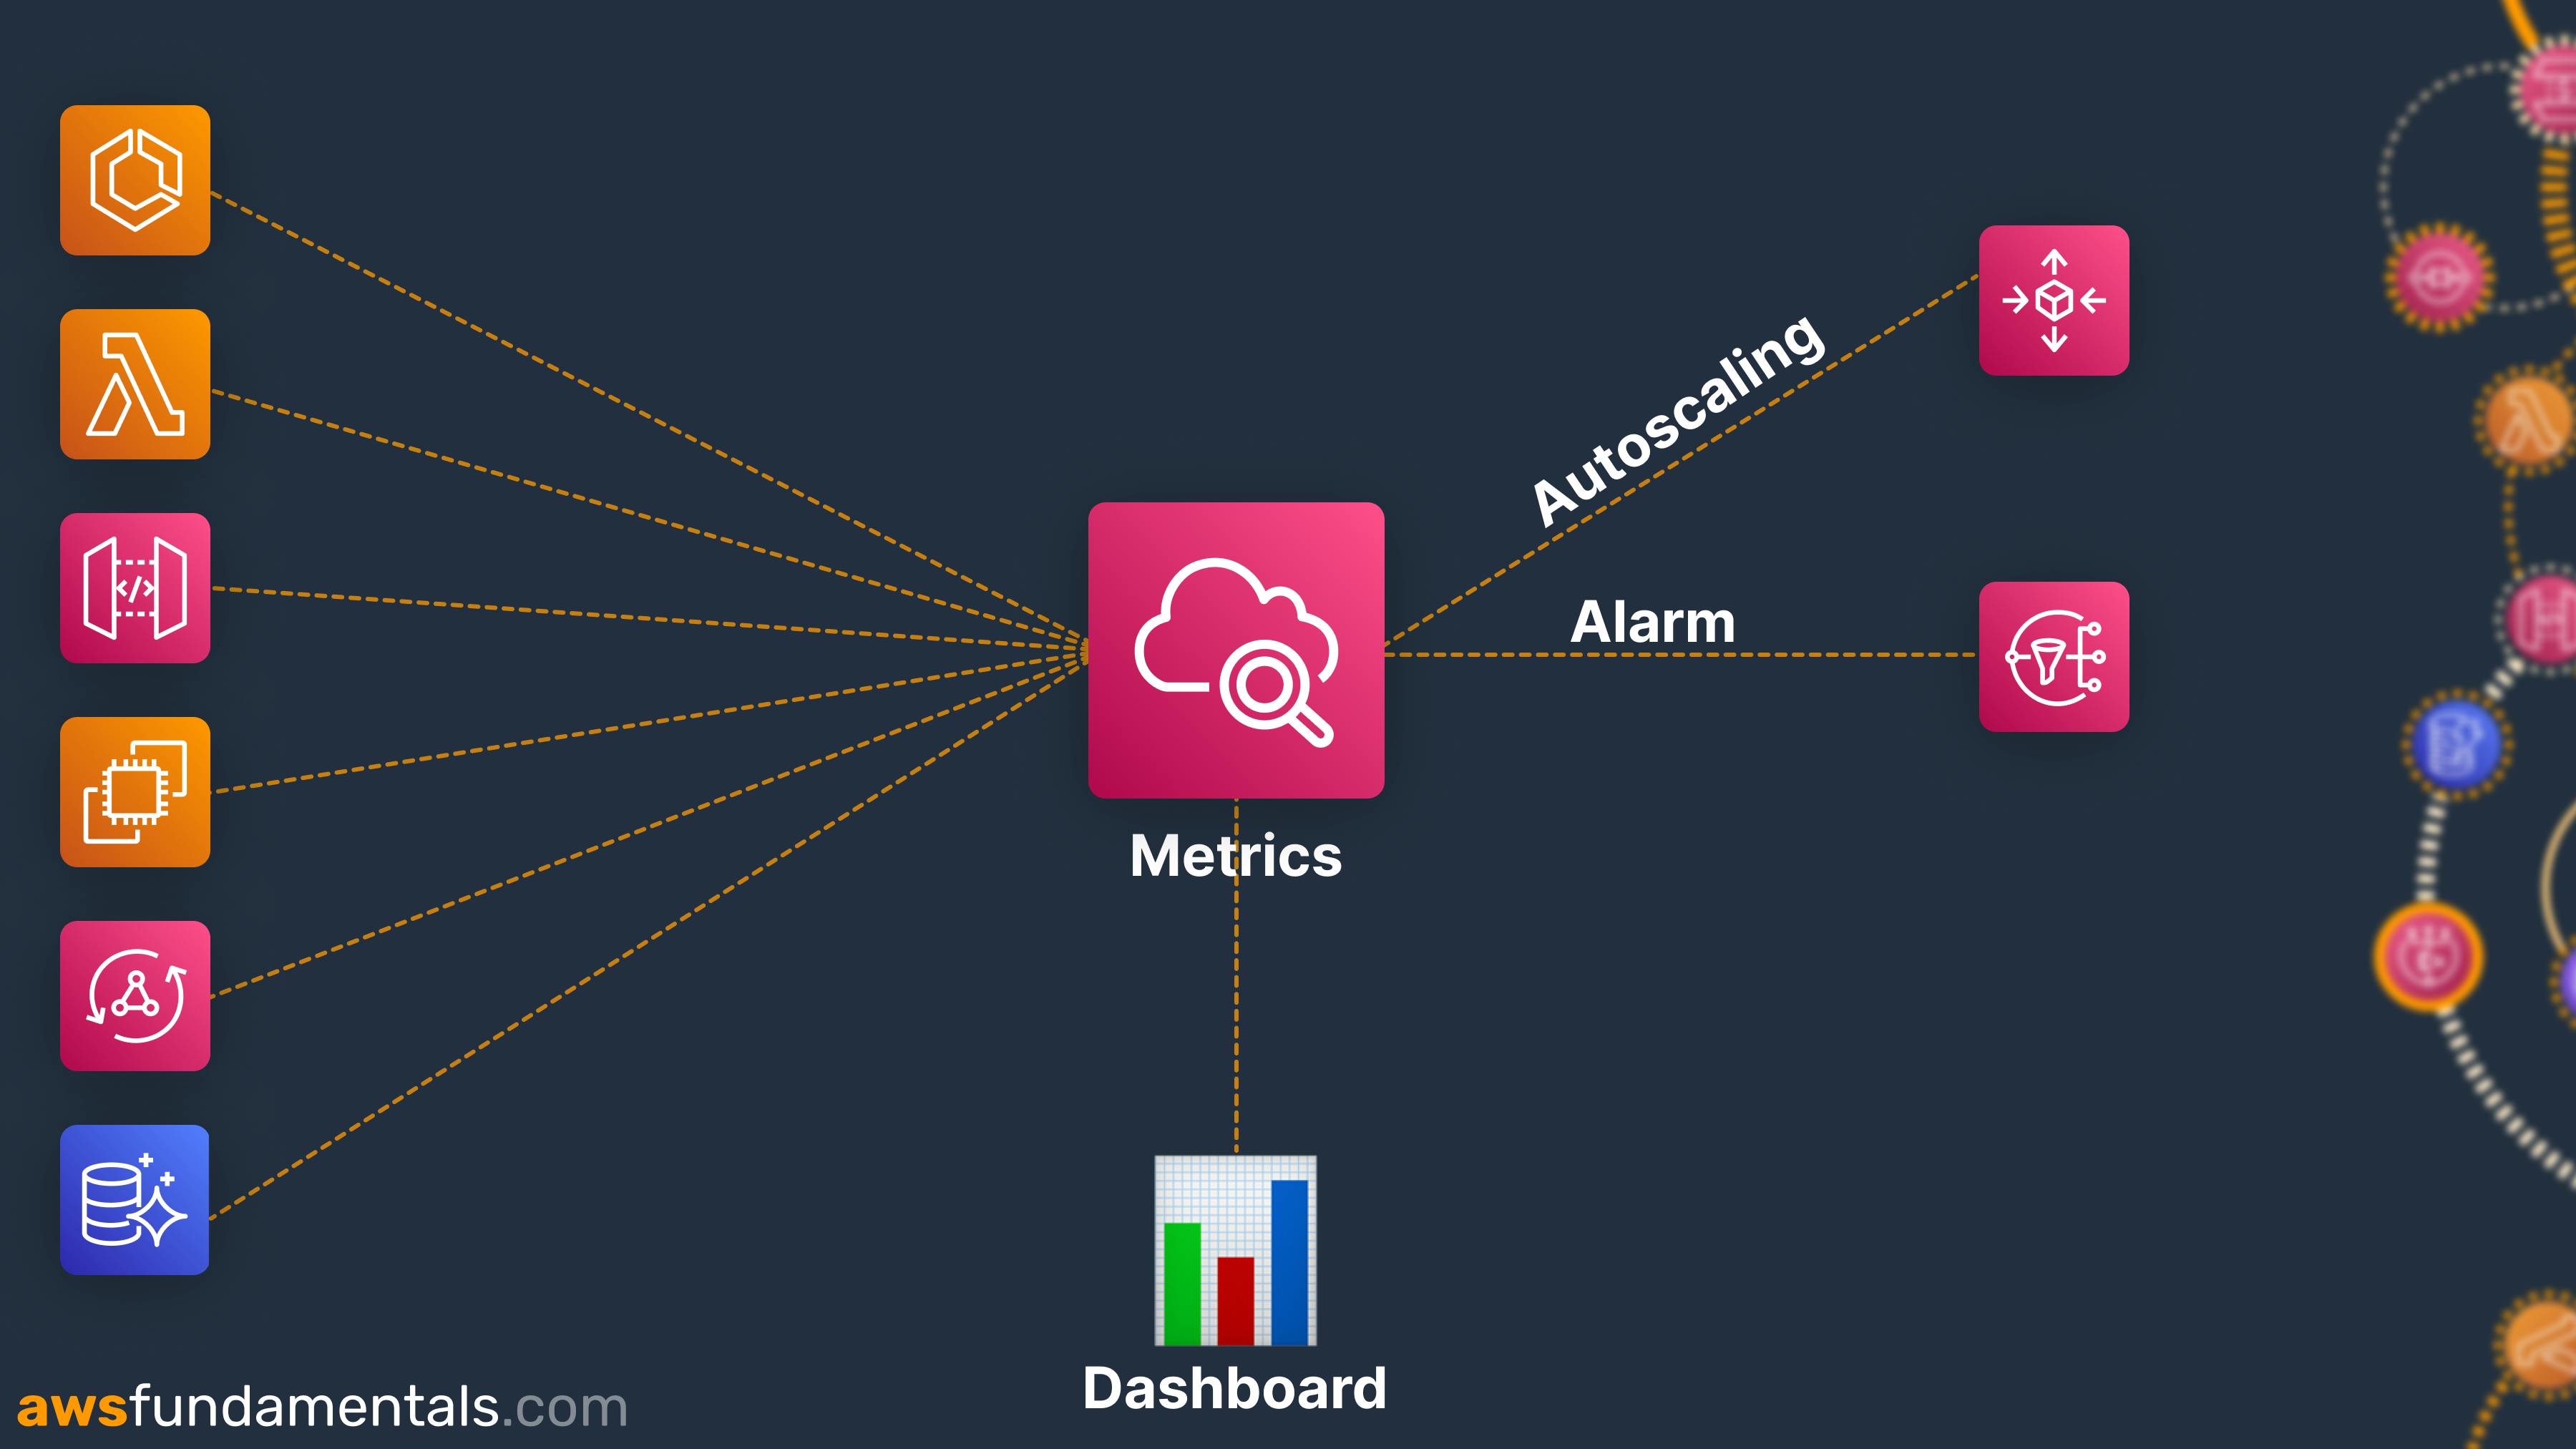
Monitoring and managing resources is an important part of making sure your serverless application is working as expected and troubleshooting when issues arise. Amazon Web Services (AWS) provides a wide range of services to monitor and track the performance of your resources. One of these services is CloudWatch, which allows you to collect and track metrics, collect and monitor log files, and set alarms for all the AWS Services.
This article will discuss such metrics, specially custom metrics in depth. We will also understand when they can be helpful, and how to add them to using SST. At last, we will look at how we use them at Hashnode.
Let's start by understanding the platform Serverless Stack (SST) and how it helps in developing serverless applications.
What is SST
SST (Serverless Stack) simplifies developing and deploying AWS applications. SST's construct makes it easy to add features with very few lines of code.
The create-sst CLI helps us create a new SST app with a basic structure. The cd command changes the current directory to the new app and npm install will install the required dependencies.
Finally, you can run sst start to deploy your sandbox environment to AWS and start your debug stack.
npx create-sst@latest my-sst-app

cd my-sst-app
npm install

npx sst dev
The CLI will ask you to pick a stage name which can be your name. Once the setup is complete, the app will be deployed to AWS and connected to the local machine. You can then jump to the SST console https://console.sst.dev/ which will stream all the logs.
What are Custom Metrics and When To Use Them
Custom metrics allow us to monitor specific aspects of your application beyond the scope of default metrics provided by AWS. The default metrics provided by CloudWatch include instance metrics, traffic mirroring metrics, error metrics, etc. Still, we might need more information about our serverless app.
Custom Metrics come in handy when we need a piece of more specific information like the number of times an API is called, the origin of requests, requests that resulted in a particular error code, metrics with additional information, etc. Custom metrics can provide more context to your metrics by adding custom dimensions that help you filter and group your metrics in CloudWatch.
It can help in various other aspects like analyzing data over a period of time, creating alarms based on specific thresholds of error requests, number of concurrent users, etc. Custom metrics provide granular control over the aspects of the serverless applications we want to measure. It's up to us to get the insights that help us improve the performance and manage the application.
Creating Custom Metrics with SST and CloudWatch
There are mainly three ways to create custom metrics in CloudWatch.
API
CLI
Embedded Metric Format (EMF)
We are interested in using EMF for the scope of this article.
Embedded Metric Format (EMF) is a format that is used to send custom metrics to CloudWatch. CloudWatch can automatically extract custom metrics based on the logs it receives in Embedded Metric Format, allowing us to add alarms or visualise them in detail.
EMF is particularly useful when sending a large number of custom metrics, as it allows you to send them in batches via logs. An embedded metric format looks like this:
{
  "_aws": {
    "Timestamp": 1574109732004,
    "CloudWatchMetrics": [
      {
        "Namespace": "lambda-function-metrics",
        "Dimensions": [["functionVersion"]],
        "Metrics": [
          {
            "Name": "time",
            "Unit": "Milliseconds",
            "StorageResolution": 60
          }
        ]
      }
    ]
  },
  "functionVersion": "$LATEST",
  "time": 100,
  "requestId": "989ffbf8-9ace-4817-a57c-e4dd734019ee"
}
Refer to this documentation for detailed specification on EMF
Sending Custom Metrics to CloudWatch
We use AWS Lambda Powertool to send custom metrics to CloudWatch. Using the @aws-lambda-powertools/metrics library, you can use the Metrics class provided by the library. Here is an example of how to send a custom metric to CloudWatch using @aws-lambda-powertools/metrics:
import { Metrics, MetricUnits } from "@aws-lambda-powertools/metrics";

const metrics = new Metrics({
  namespace: "hashnode",
  serviceName: "graphql",
});

export const handler = async () => {
  const singleMetric = metrics.singleMetric();
  singleMetric.addDimension('origin', 'app');
  singleMetric.addMetric('count', MetricUnits.Count, 1);
  metrics.publishStoredMetrics();
};
In the example above, we have defined the custom metric with namespace, dimension and unit. Let's understand them a little better:
1. Namespaces
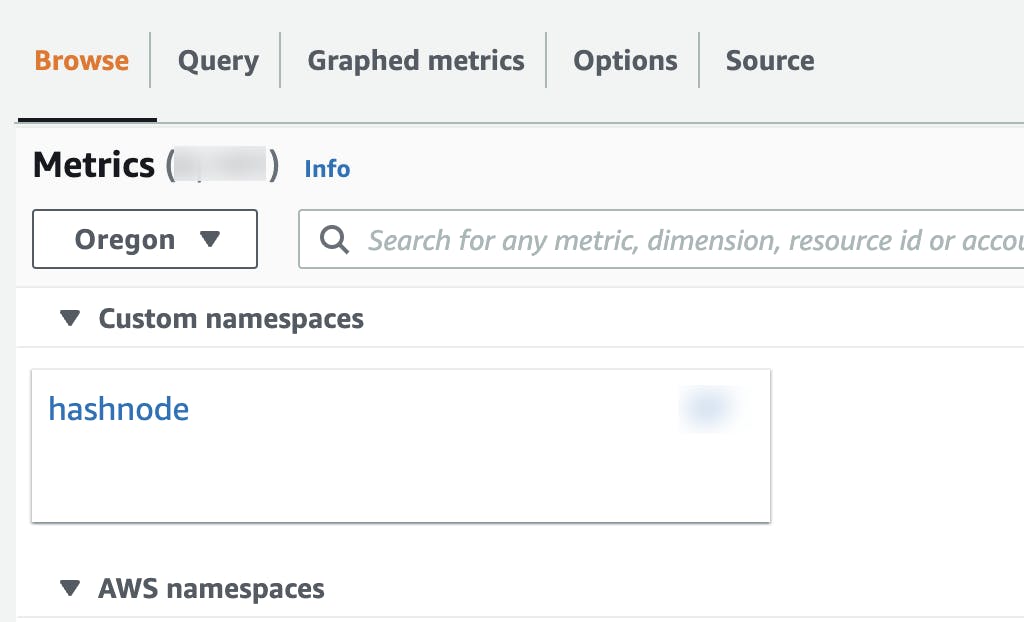
A namespace is a container for CloudWatch metrics. We can create multiple namespaces for different metrics and distinguish them from each other. For example, AWS Amplify stores the metrics under AWS/AmplifyHosting namespace.
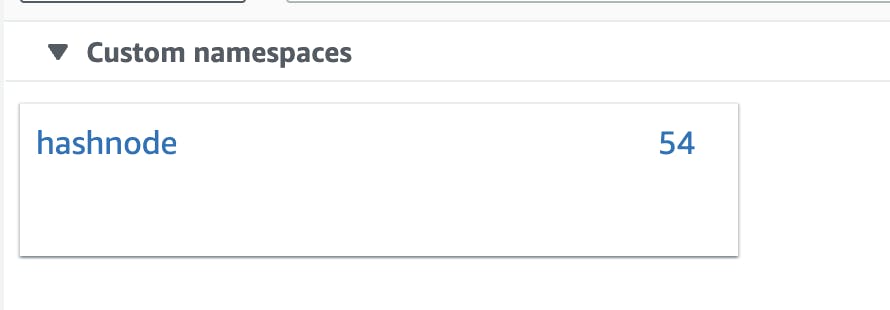
In the above example, we are creating a custom namespace hashnode to group all the Hashnode-related metrics. It will look something like this on the console:
2. Dimensions
A dimension is a name-value pair that help us describe and categorise the metric. Custom dimensions are additional information that helps us filter and group metrics in CloudWatch.
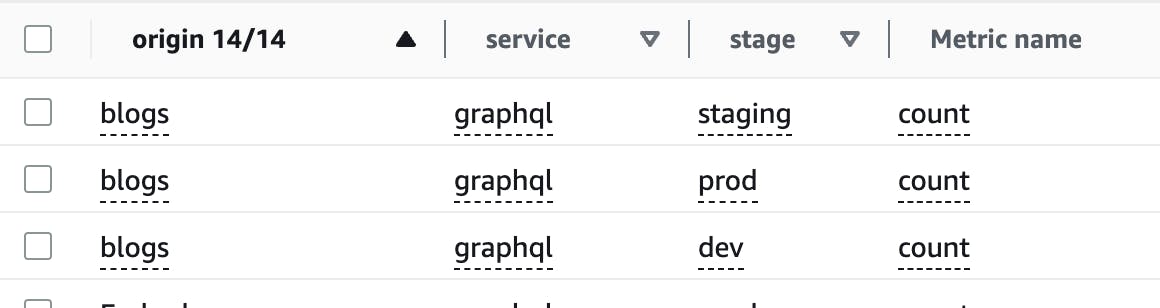
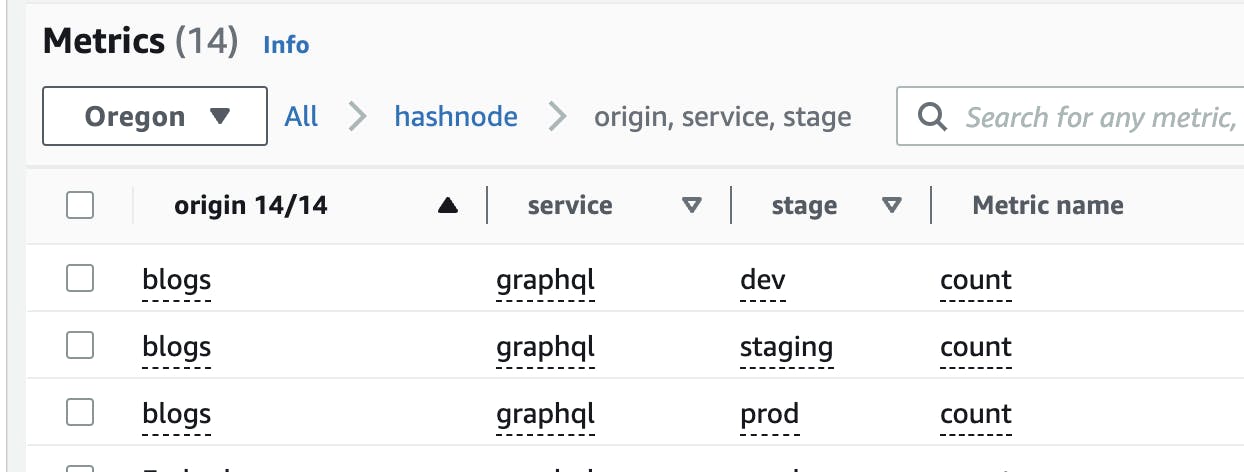
In the above example, we are adding a dimension origin to track the origin of a request. This origin dimension can be used to group and filter metrics by the origin of the request. Another example of dimension could be adding stage property, which keeps track of the environment of the request. It can be production, dev, or staging which can further be used for filtering or sorting.
It will appear like this in the AWS console:
3. Units
A unit is simply the data type we use as a measure. A unit can be Bytes, Seconds, Microseconds, Count and Percent, etc. In our case, we are using Count as a unit and setting its value to one.
The resulting log will look something like this in the embedded metric format:
{
    "_aws": {
        "Timestamp": 1679312949002,
        "CloudWatchMetrics": [
            {
                "Namespace": "hashnode",
                "Dimensions": [
                    [
                        "origin"
                    ]
                ],
                "Metrics": [
                    {
                        "Name": "count",
                        "Unit": "Count"
                    }
                ]
            }
        ]
    },
    "service": "graphql",
    "order": 1
}
How to Check Custom Metrics on CloudWatch
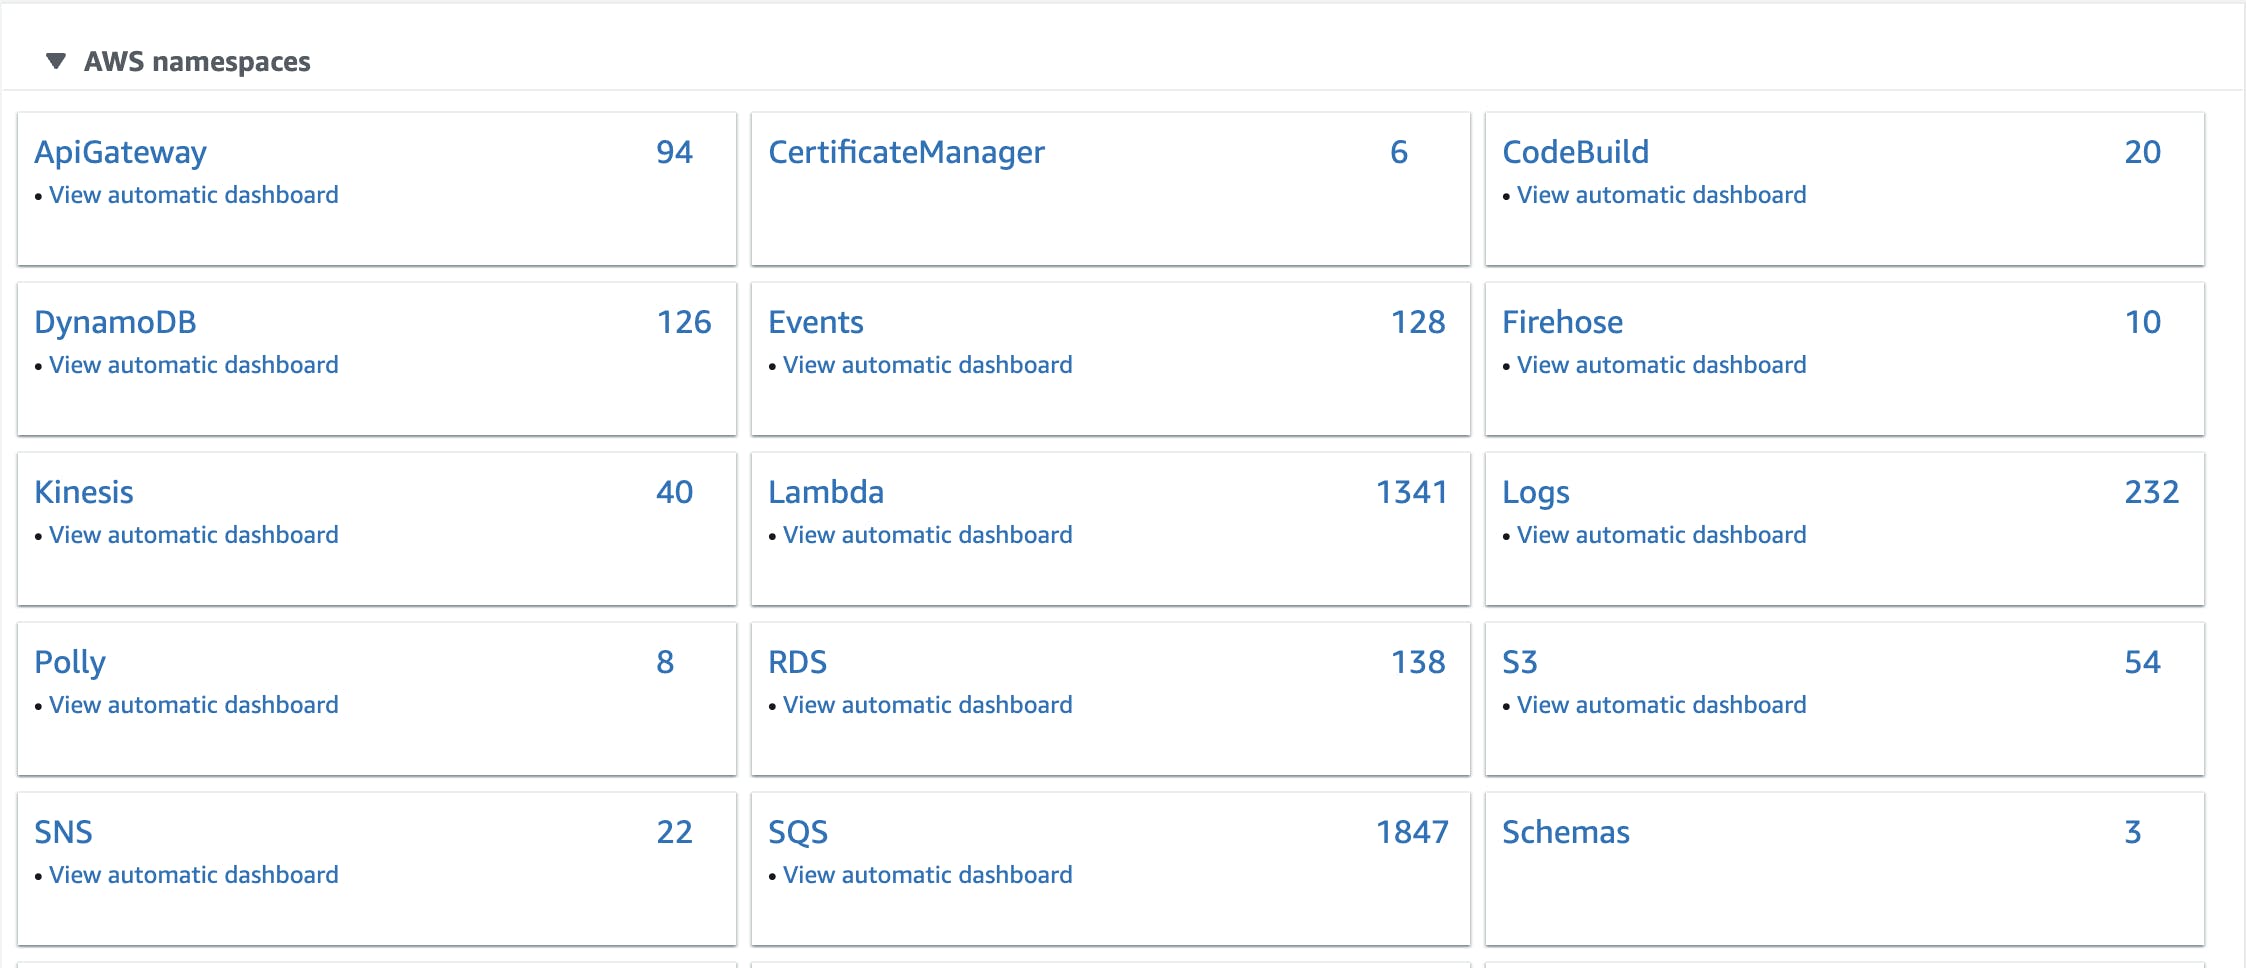
Once we are done with adding custom metrics, we can head over to CloudWatch to check the logs. Go to the metrics overview in CloudWatch and find the custom namespace we just added.
If you click on the namespaces, you will see your metrics.
How We Are Using Custom Metrics at Hashnode
At Hashnode, we use custom metrics in multiple ways. Let's delve into some of these metrics and explore them thoroughly.
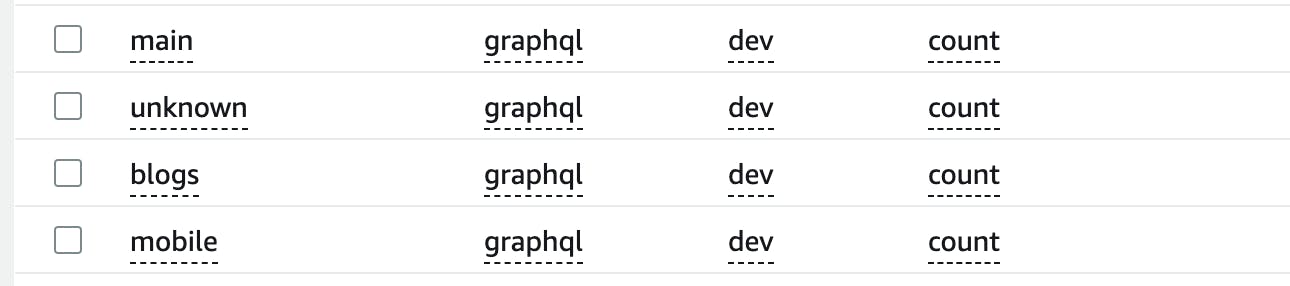
Tracking Origins of GraphQL Requests
We use GraphQL APIs at Hashnode, which are utilized by multiple apps, including the community front, the blog front, and the mobile app. Knowing the origin of these requests is essential to allocate resources accordingly. Custom Metrics help us identify the number of requests originating per app.
Tracking Application Version and OS for Mobile App
We use custom metrics to track usage by each application version and OS for Hashnode mobile app. Multiple active mobile app versions can be installed on different devices on different platforms. Custom Metrics have proven invaluable in providing great insight into the mobile app user base.
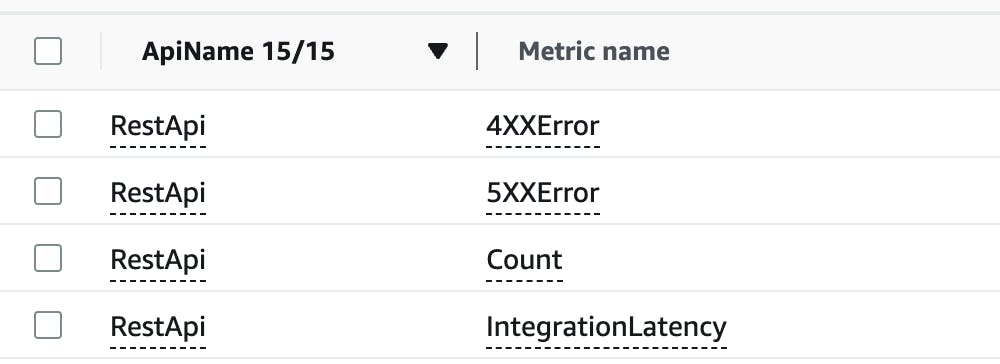
Tracking Errors via Error Code
We use custom metrics to record errors by error codes and rearrange them for easy monitoring. We can get insights about errors thrown per app/lambda categorized by the error code.
Metrics associated with error codes allow us to have precise control over what occurs during an incident. For instance, we can associate a 5xx error code with an AWS alarm that can heighten the issue and notify the team during downtime. Refer to the next section for more info on how to use alarms with metrics.
Using Data to Set Alarms
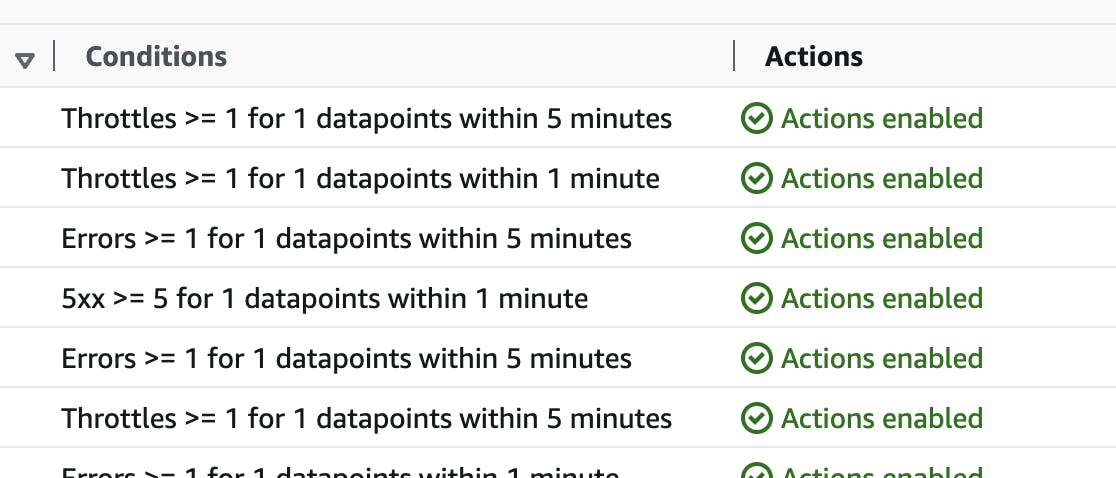
We utilize the historical data of the metric when monitoring errors by error code, and set up alarms to notify us when it surpasses a certain threshold.
For example, we define threshold as "Errors >= 1 for 1 datapoints within 1 minute" under conditions while creating an alarm. This will ensure that the associated action is triggered when the threshold is reached.
The action can be enabled to send one or more notifications via SNS informing the person on-call.
Conclusion
Adding custom metrics to your serverless application is essential for monitoring and optimizing its performance. Embedded Metric Format provides an easy way to send logs and extract custom metrics to CloudWatch for monitoring. We also learned how we utilize custom metrics at hashnode.
Do let us know if this article was helpful in the comments.
Checkout this article for a more detailed guide on Custom Metrics.